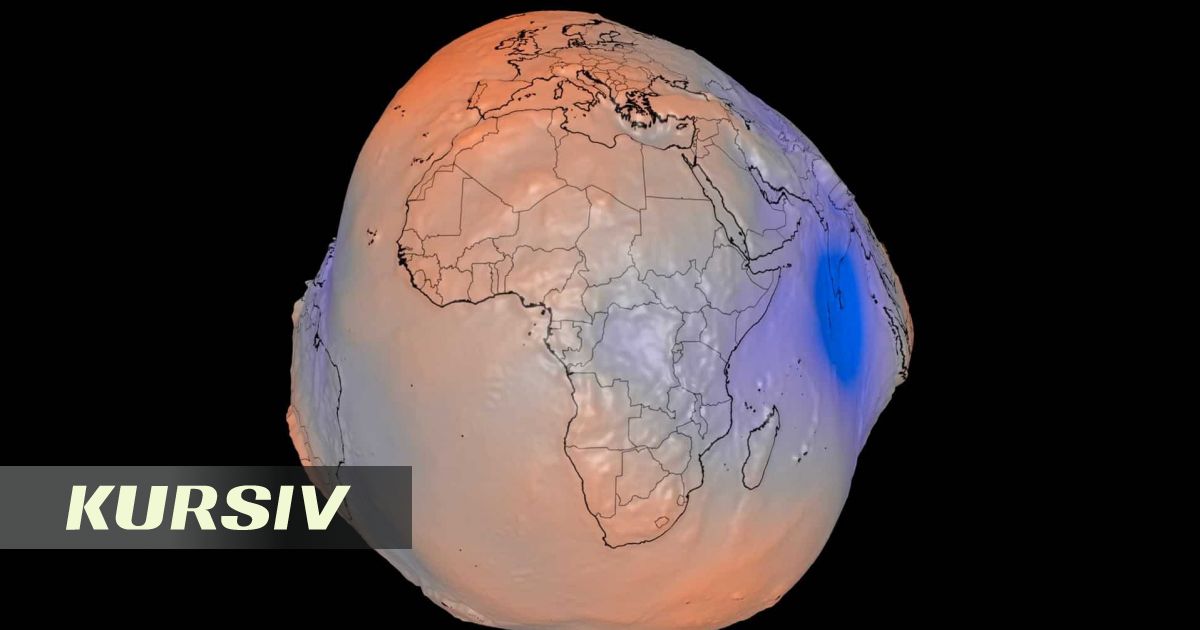
NASA has presented a new three-dimensional model of the geoid, created from satellite observations of Earth. The visualization shows the planet not as a perfect sphere, but as an uneven object with bulges and depressions. This was reported by Qazaqyia.kz citing Kursiv Media.
The geoid represents the hypothetical surface of the global ocean influenced only by gravity, without considering wind, currents, or tides. The model reveals differences in gravitational pull caused by uneven mass distribution within the planet.
Areas with denser rocks and other massive structures create stronger gravitational attraction, appearing as conditional "hills" on the model. In regions with lower density, gravity is slightly weaker, forming "depressions."
To make these differences visible, NASA specialists exaggerated the height of irregularities by about 10,000 times. In reality, the variations are only a few dozen meters and are invisible to the naked eye.
One of the highest points of the geoid is near Iceland, approximately 85 meters above the average level. The deepest area is located south of India, where the value drops about 106 meters below the average.
The visualization is based on data collected over 15 years, including about 1 billion observations from satellites.
The geoid is used not only to study Earth's gravitational field but also to track changes in global sea levels, glacier melting, groundwater depletion, and drought impacts.
According to observations, from 2002 to 2025, Antarctica lost an average of about 135 gigatons of ice per year, while Greenland lost about 264 gigatons. The model also helps analyze water storage changes and monitor extreme droughts in various regions, including Spain and France.